
ARIMA with python
宇宙安全声明
不保证对,不保证结果哪怕有一点沾边,不保证代码能跑,不保证跑了就能跑对。。。仅供参考
Might be Useful
说白了这个文件就是防止你read_excel把第一行数据read成标题的。。
Find Parameters
Calculating AIC value to optimize the p and q.
PS:这玩意咱从网上抄的,xuehan上课给的那个咱没看懂。。。能不能用的咱也不好说,但是结果似乎靠谱
import pandas as pd
import numpy as np
from statsmodels.tsa.arima.model import ARIMA
from statsmodels.tsa.stattools import arma_order_select_ic
# Load the dataset(replace with you own path)
data = pd.read_excel("/kaggle/input/cat-arima/cat2.xlsx")
# since year is kind of useless here...
data=data['cat']
# Specify the range of values to test for p and q
p_values = range(0, 5)  # Example range for p
q_values = range(0, 5)  # Example range for q
# Perform grid search using AIC
best_aic = np.inf
best_p = 0
best_q = 0
for p in p_values:
    for q in q_values:
        try:
            model = ARIMA(data, order=(p, 0,q))
            results = model.fit()
            aic = results.aic

            if aic < best_aic:
                best_aic = aic
                best_p = p
                best_q = q
        except:
            continue
# Print the optimal values of p and q
print(f"Best AIC: {best_aic}")
print(f"Optimal p: {best_p}")
print(f"Optimal q: {best_q}")
Train the model
Train the model
import pandas as pd
import numpy as np
from statsmodels.tsa.arima.model import ARIMA
import matplotlib.pyplot as plt
# Step 1: Load the Data
data = pd.read_excel('/kaggle/input/cat-arima/cat2.xlsx')
# Step 2: Model Fitting and Parameter Selection
# Fitting the ARIMA model
model = ARIMA(data['cat'], order=(2, 0, 4)) # Replace p, d, q with appropriate values
model_fit = model.fit()
# Step 3: Forecasting the Entire Pattern
# Forecasting for the entire pattern
forecasted_values = model_fit.predict(start=0, end=len(data) - 1)
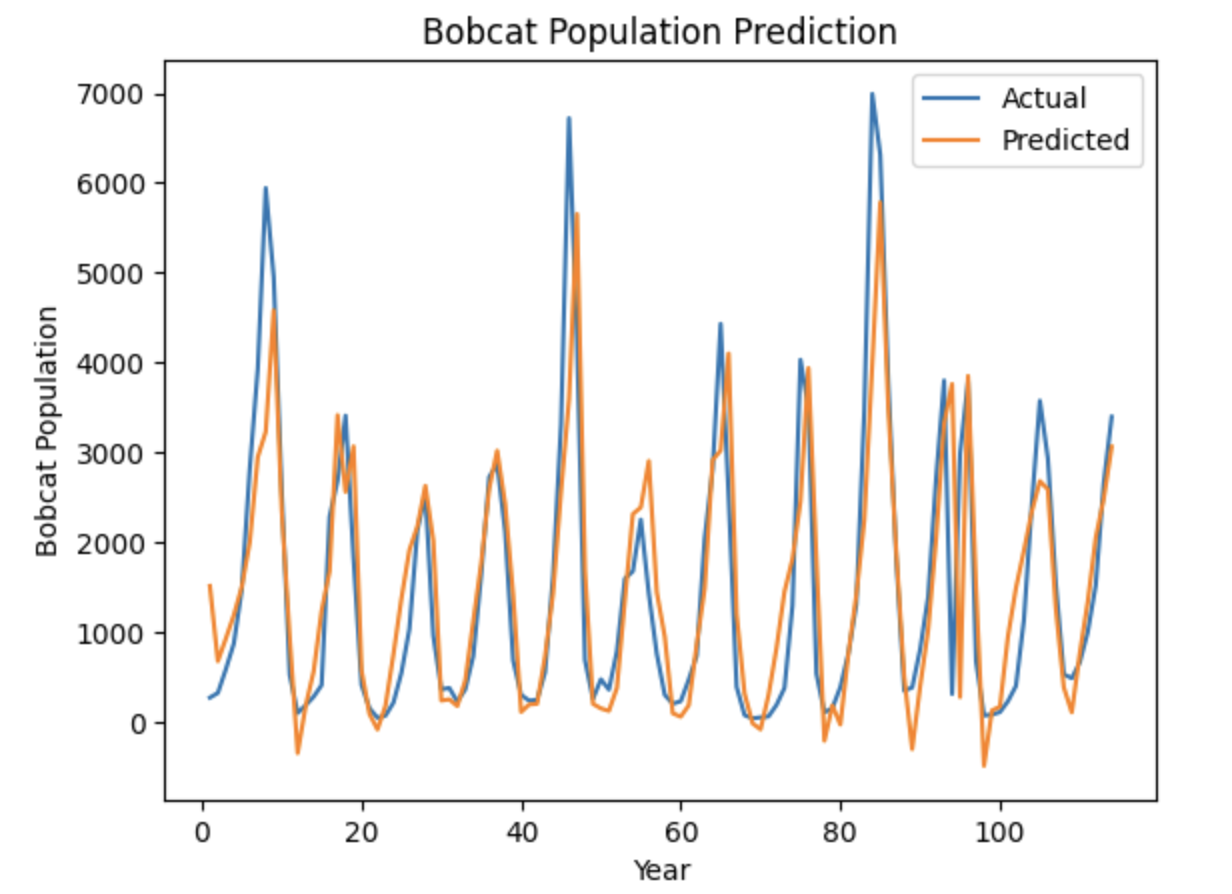
# Step 4: Results Presentation
# Plotting the actual and predicted values
plt.plot(data['year'], data['cat'], label='Actual')
plt.plot(data['year'], forecasted_values, label='Predicted')
plt.xlabel('Year')
plt.ylabel('Bobcat Population')
plt.title('Bobcat Population Prediction')
plt.legend()
plt.show()
# Printing the forecasted values
print('Forecasted values for the entire pattern:')
for year, value in zip(data['year'], forecasted_values):
print(year, ':', value)
Note
Environment
if you decide to run these code on local environment, you may need to install all those library.
!pip install numpy
!pip install matplotlib
!pip install pandas
!pip install statsmodels
推荐!!!:
2023/10/17
似乎p取值10或者9是可行的,然后d貌似无所谓。。。